A Zoomable Interactive Python Thread Visualization
Presented at PyCON'2010
Atlanta, Georgia
February 20, 2010
David M Beazley (http://www.dabeaz.com)
Introduction
This page presents a visualization of Python thread scheduling and behavior of the Global
Interpreter Lock (GIL) on a variety of different platforms and system
configurations. As background, you should refer to the slides of my
Understanding
the Python GIL talk as well as the
GIL talk that I gave
last
summer at the Chicago Python Users Group (Chipy) meeting.
How to Interpret the Plots
In the visualization, you are going to see a collection of tiles
that look like this:
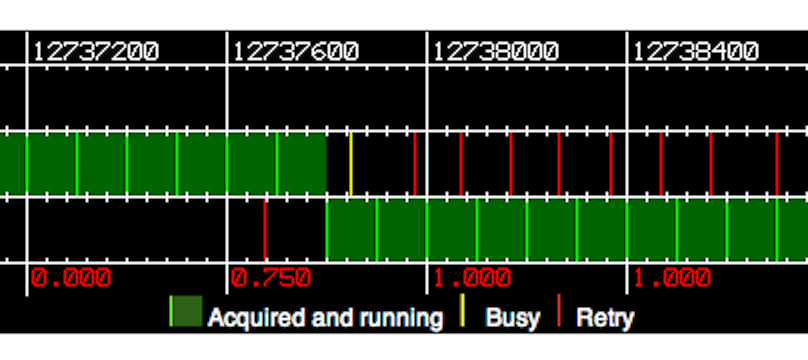
The following information is shown:
- The numbers across the top represent the total Python
interpreter ticks that have executed so far. Each tick roughly
corresponds to a single virtual machine instruction. For all
practical purposes, the ticks represent execution time.
- The image is divided horizontally into regions where each region
represents the actions of a different thread. In the above image, there
are three threads. The top thread is the "main thread." You
read the plot left-to-right to see the sequence of events.
- A bright green line represents the time at which a thread acquires the
GIL and starts running. Darker green regions show the time when
a thread is executing. Green is good!
- Yellow and red lines indicate the first and subsequent times
that a thread is awakened by the
operating system to run, but execution was suspended due to the GIL
being acquired by a different thread. These events should be
viewed as "False Alarms" and are always bad because they add extra
system overhead. Red is bad!
- The red numbers at the bottom are a "badness measure" for
the failed GIL acquisitions described in (4). The number is the ratio of
failed GIL acquisitions to the total number of "checks" that have
been performed (recall that checks occur every 100 ticks). For example, in the second box from the left,
three failed acquisitions occur over the span of 400 ticks or 4
checks so the ratio is 0.75. Smaller ratios are better!
All of the visualizations allow zooming and panning. Click on the
mouse and move left and right to scroll the image. Click on the "+"
and "-" to change the scale. Many interesting things start to
appear the further you zoom in.
Take Me To The Visualizations!
Follow these links to look at different visualizations:
About the Visualizations
All of these visualizations were generated from thread/GIL trace logs
created by a custom-modified version of Python 2.6. Some details of
these customizations can be found in my blog post Inside
the Inside Python GIL Presentation. I improved the logging
mechanism somewhat since that blog post, but the general idea is still
the same.
Log trace data was processed by a custom processing script that I
wrote to render the data into a very large collection of PNG image tiles.
PNG image writing was done using the pypng library. The scrollable
Javascript interface was adapted and hacked from Michal Migurski's
GSV library.